In my workshops, different stakeholders often come together and so far I had of course perceived their feedback, but never sorted it. With the help of perceptual mapping, you can how consumers perceive different offers visualize in a diagram. This gave me new insights that I would like to share here:
To apply the perception map to my problem in the field of business TRIZ, I proceeded as follows: First, I generated perceptions using AI for given stakeholders. The next step was to create a perception map manually.
The AI prompt generated perceptions, as I could not easily access a survey of the different stakeholder groups.
These were my stakeholders:
- Engineers who do not know TRIZ and did not hear anything about it until now
- Engineers who have heard of TRIZ but did not learn it
- Engineers who had a Basic course and would like to learn more
- TRIZ Experts within companies
- TRIZ Experts who are consultants, freelancers
- People who would like to teach TRIZ
- People who would like to use TRIZ in workshops
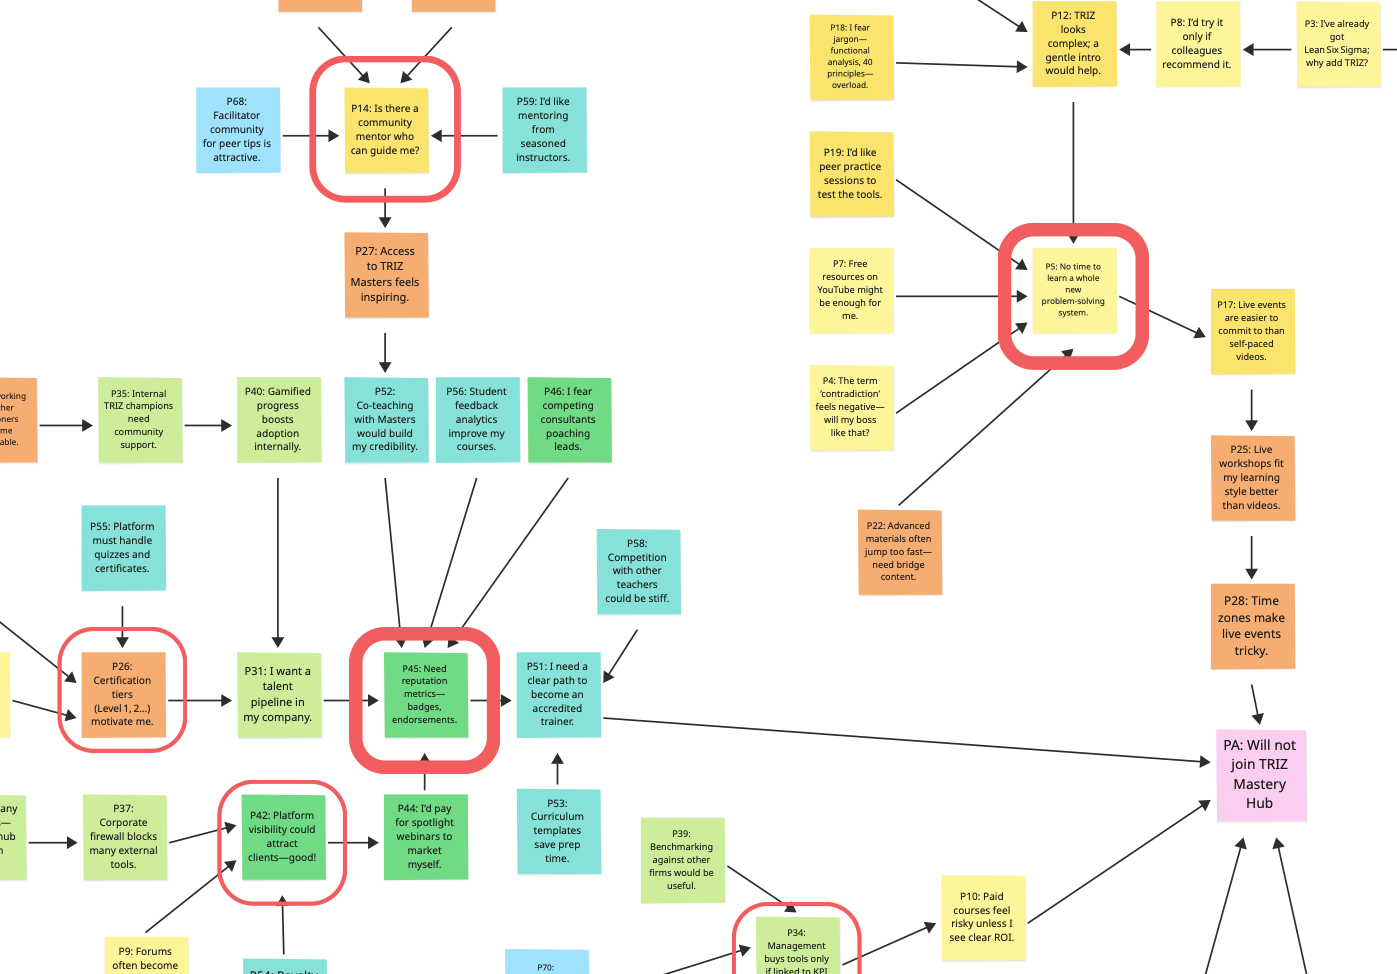
For each stakeholder group, I had around ten perceptions that seemed to make sense. I compiled these on a concept board (Miro) as cards to form a perception map. The cards were colored in different colors for each stakeholder.
On a perception map, cards that collect insights from different perception strands form interesting nodes that should be tackled first – i.e. the problem areas in the task.
Due to the different coloring, I noticed that there are points that are apparently only interesting for one stakeholder group because only the cards of one color come together there. But there are also points where cards of different colors come together. These are then of interest to several stakeholders and, in addition to the calculated priority value, provide me with a further indication of where I need to start working on the problem.